1. Create an Account
As a caregiver, you have access to the CRANE Caregiver web portal where you can view health data shared by your patients. To get started, create a caregiver account through your healthcare organisation. Once your account is set up, you can log in to the Caregiver web portal.
Only patients who have chosen to share their health data with your region will be visible in your patient list. Patient data sharing is always initiated and controlled by the patient through their MyHealthEnabler app.
2. Overview of Patients
After logging in, the Caregiver web portal displays an overview of all patients who have shared their health data with you. The My Patients view shows:
- Patient name
- Personal identity number
- Date of latest measurements
- Total number of measurements
You can search for a specific patient using the search bar at the top. Click on any patient row to view their detailed health data.
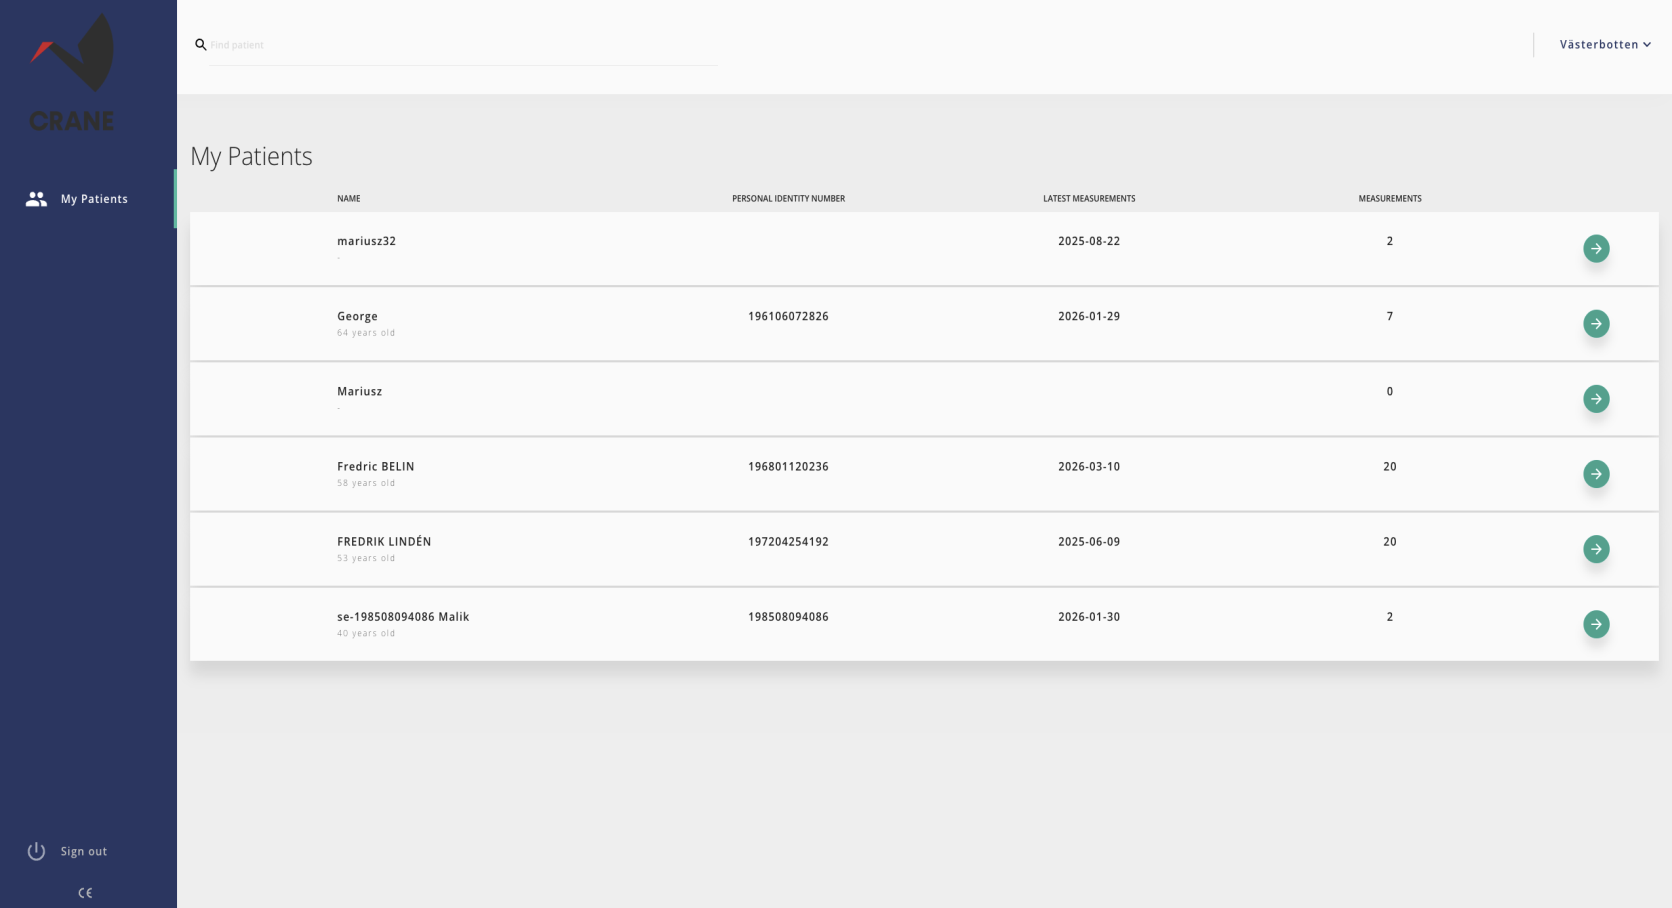
Caregiver web portal - My Patients overview showing patient list with names, identity numbers, and measurement counts
3. Patient Data View
When you click on a patient, you see their complete health data overview. The patient profile header shows their name, age, weight, height, and contact details (email, phone, address).
Below the header, the dashboard displays cards for each type of health data being collected:
- Questionnaires - survey responses
- Blood pressure - systolic and diastolic readings over time
- Weight - weight measurements with trend graph
- Hemoglobin - hemoglobin levels (g/l)
- Glucose - blood sugar levels (mmol/l)
- CRP - C-reactive protein levels (mg/L)
- Temperature - body temperature readings
Each card shows a small trend chart and the latest value. Click on any card to view the full measurement history.
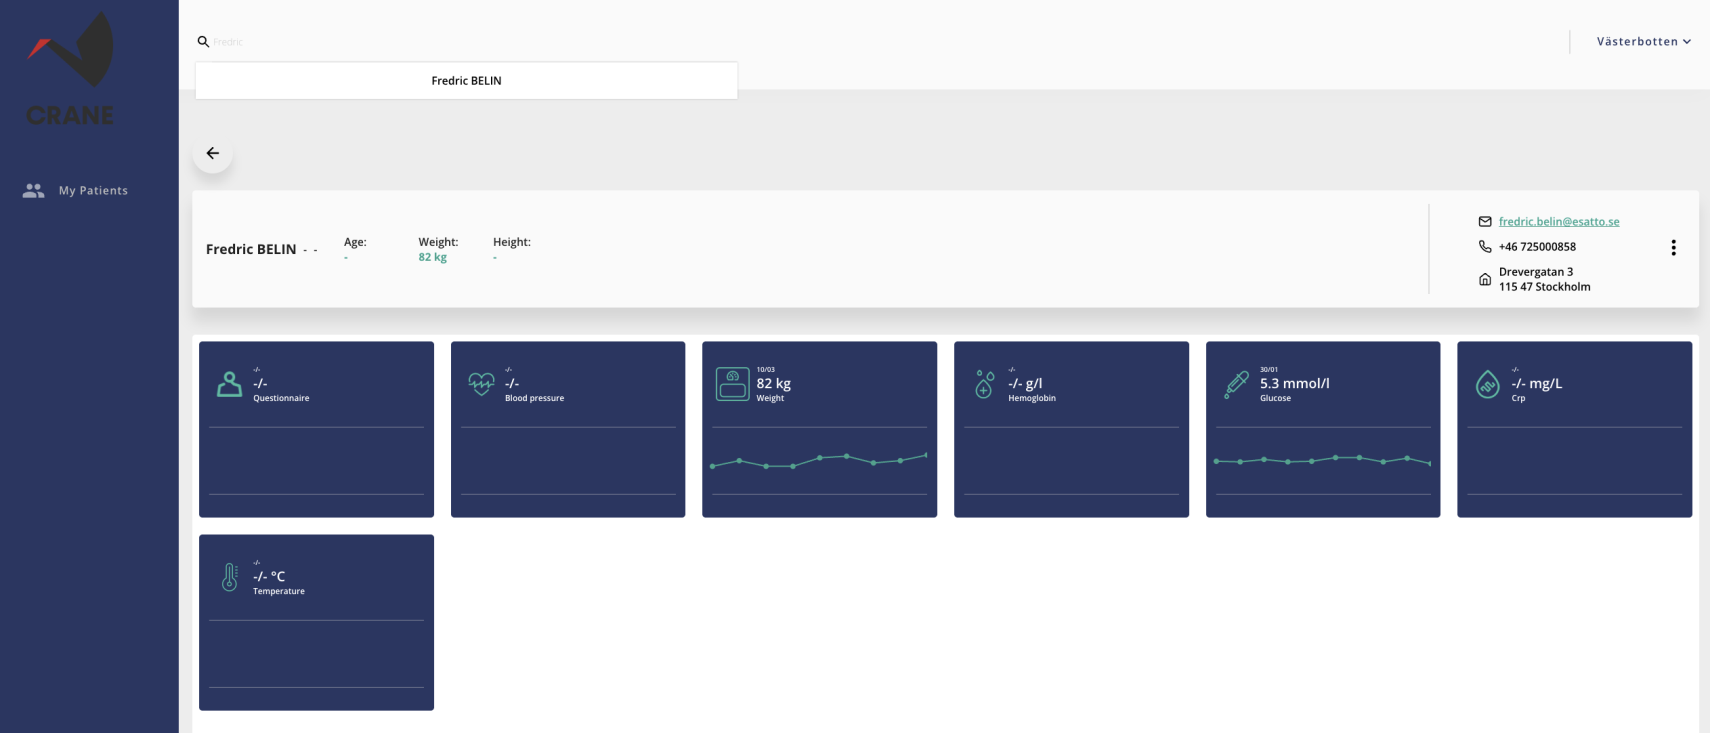
Patient data overview showing health metric cards for questionnaires, blood pressure, weight, hemoglobin, glucose, CRP, and temperature
Measurement History
When you open a specific measurement category, you can see the full history with an interactive chart showing values over time. Below the chart, the Measurements History tab lists each individual reading with its date and value. You can also switch to the Survey Responses tab to view questionnaire answers.
Glucose Measurements
The glucose measurement view shows blood sugar levels over time, with each data point plotted on an interactive graph. Measurement limits are displayed alongside actual values to help identify readings outside the normal range.
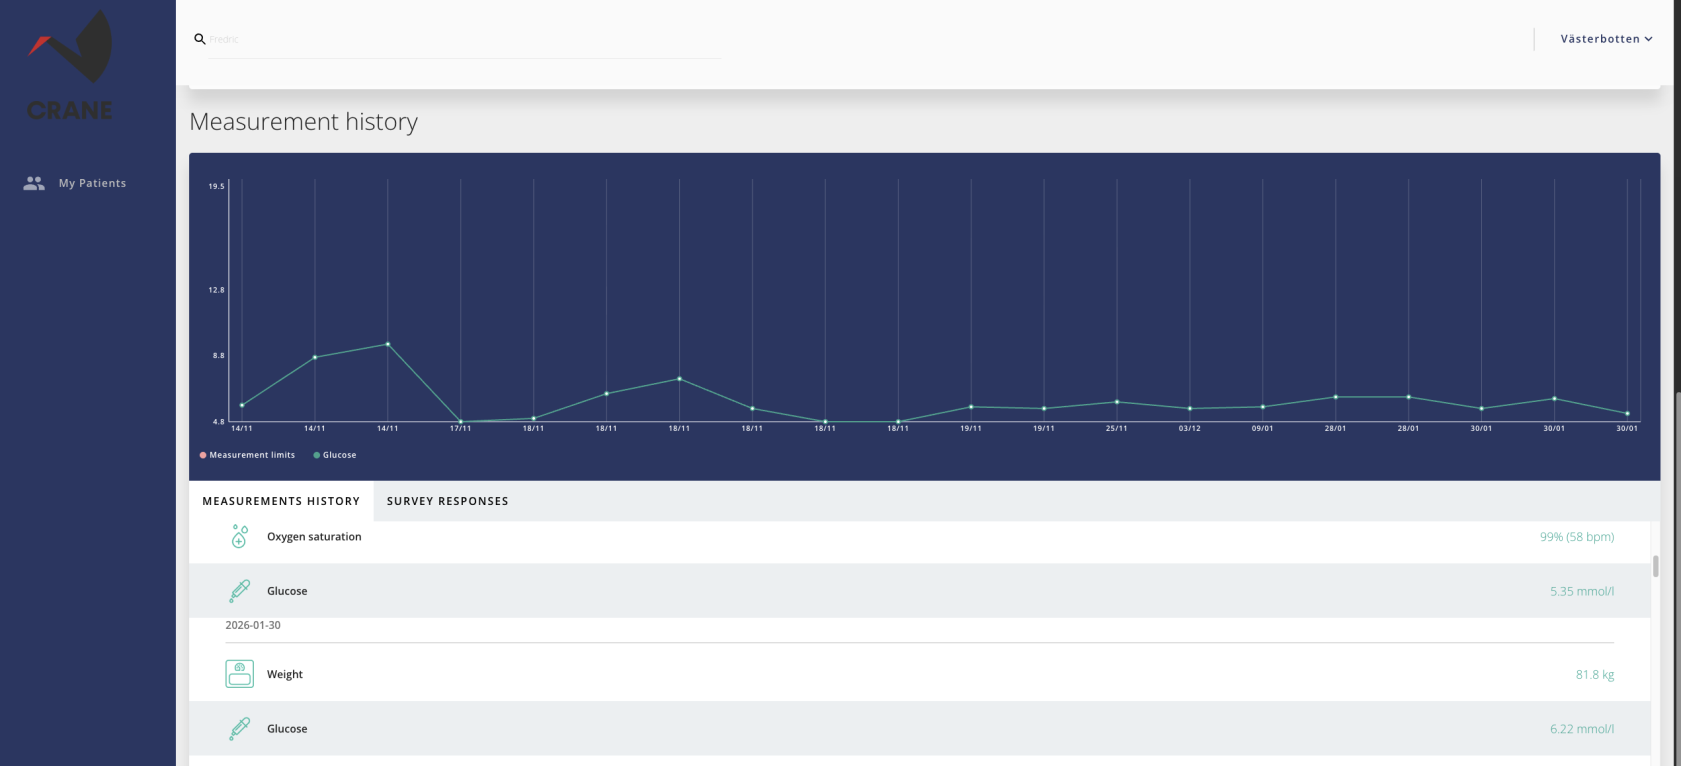
Glucose measurement history - chart showing blood sugar levels over time with measurement history list
Oxygen Saturation & Pulse
The oxygen saturation view displays SpO2 and pulse readings over time. The chart plots both oxygen saturation percentage and pulse rate (bpm), with data points you can hover over for exact values and dates.
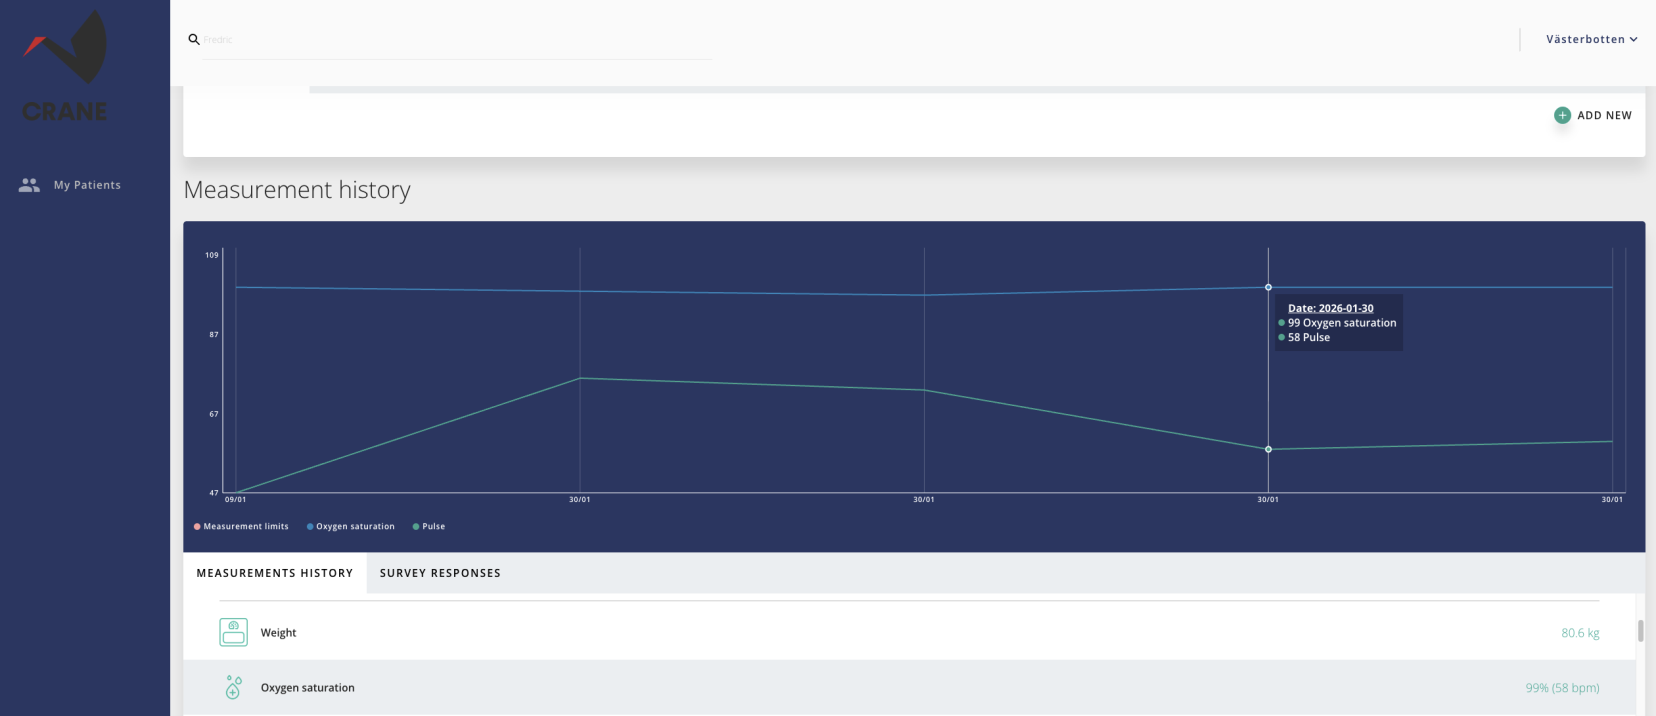
Oxygen saturation and pulse measurement history - chart showing SpO2 and pulse values over time
Weight Measurements
The weight view shows body weight measurements over time, making it easy to track weight trends. Each measurement is listed with its date and value in kilograms.
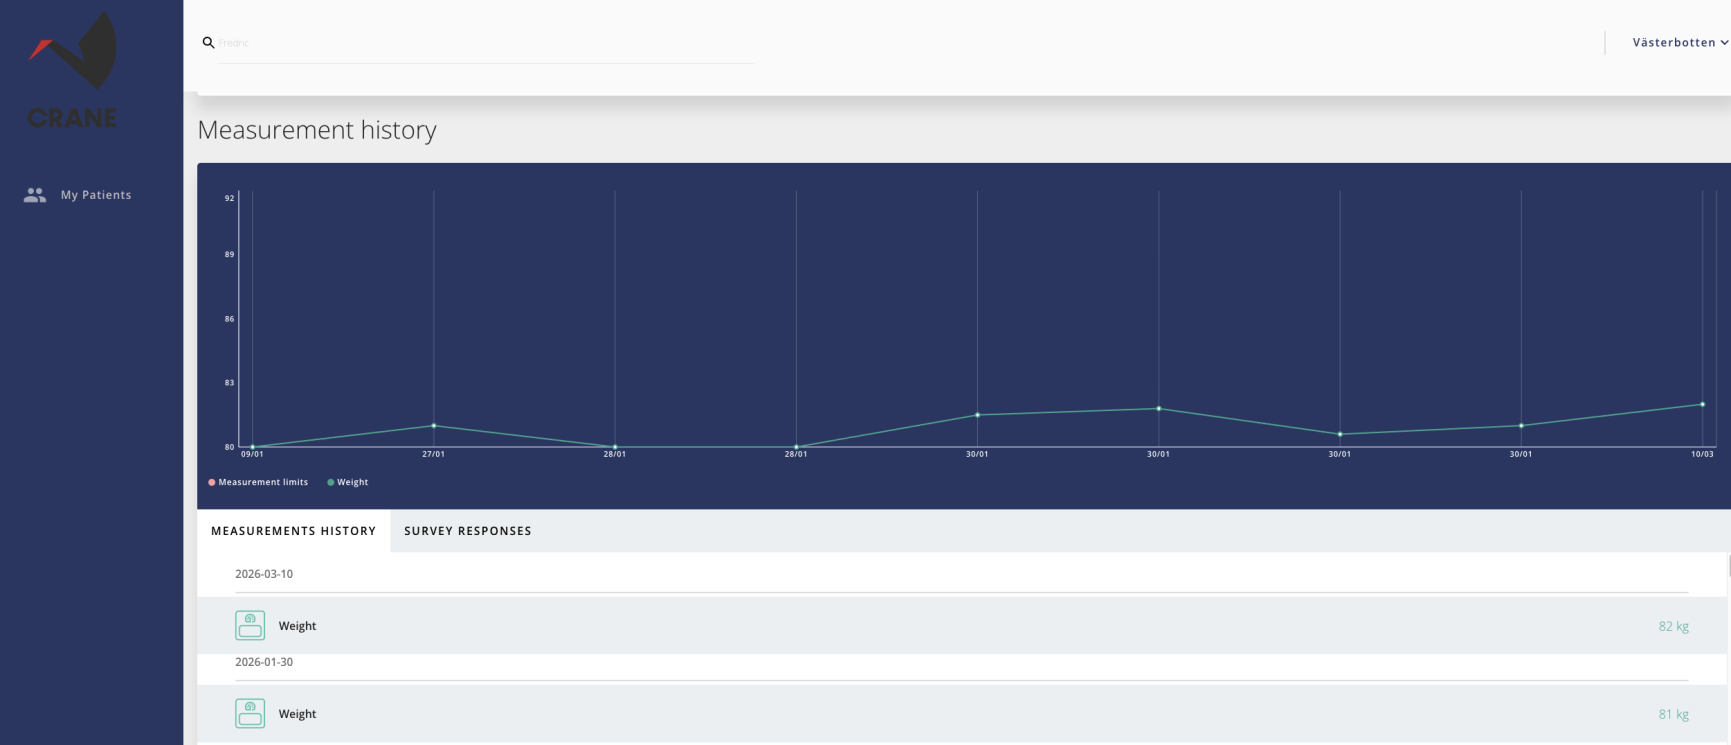
Weight measurement history - chart showing weight values over time with dated entries